 Excite Audio recently released VISION 4X, a new VST/AU/AAX analyser plugin.
Developed in partnership with electronic music trio NOISIA, Excite Audio says VISION 4X gives you the insights you need to prepare your tracks ready for competition with today's top mixes, and the clarity to make the right mixing decisions with confidence – however modest your setup.
Four Visual Dimensions
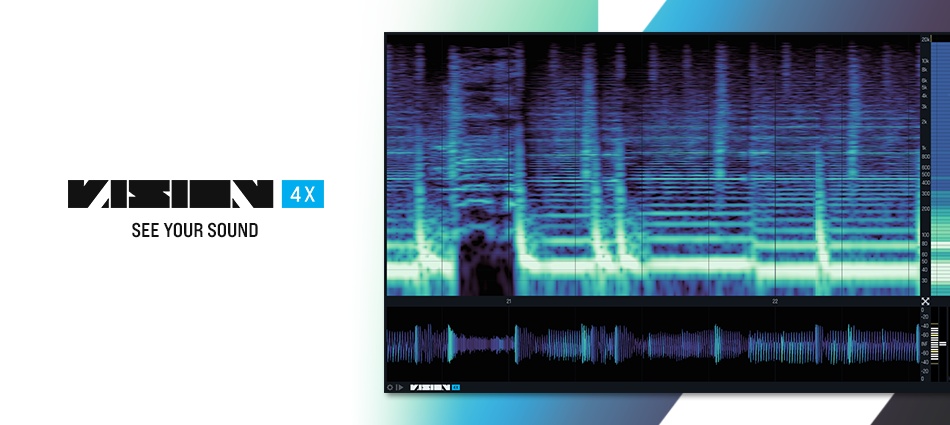
VISION 4X combines four custom-built visual analysis tools that work simultaneously in real-time, including a spectrogram, bar graph, waveform and phase correlation meter. Each analyser is displayed in its own resizable window, allowing you to scale the plugin's UI to suit your workflow.
Spectrogram
VISION 4X's powerful spectrogram provides enhanced low-end resolution, offering access to more information about the frequencies in your mix. Freeze the visualiser for a snapshot of your sound, zoom in to get a close-up of the frequency spectrum, and navigate the display to discover details that otherwise could be missed.
A selection of visualisation modes allows you to see your sound in whatever way you require. Transient mode is designed for showing the start and end point of notes, Harmonic mode gives a more detailed look at the harmonic content of a signal, and All-round offers the best solution for a general overview of your audio.
Customise the spectrogram's display with ten Colour Maps to choose from, each one specifically selected for maximum information density when analysing sound. Brightness can be biased towards the low or high frequencies using Map Bias, and Range Hz and Range Db sliders give you total control over the frequency and volume range of the display.
Bar Graph
VISION 4X's bar graph is a fully customisable spectrum analyser that can highlight the gain levels of the sustained frequencies in your sound. Choose to get an overview of how frequencies are distributed in your mix, or an intricate analysis, by varying the number of bars shown in the graph. The Speed of the bar graph's movement can be adjusted to run alongside your track however you see fit, and you can easily spot peak levels using the Peak Hold sustain control.
VISION 4X also has a Spectrum Highlight feature that indicates resonant frequencies, which can be tailored for sensitivity and matched with the colour coding of the spectrogram.
Understand and improve the balance of your mix by comparing it with reference curves from a range of genres, generated through an in-depth analysis of hundreds of tracks. Each reference curve has an average and a maximum value line, with overshooting clearly indicated in red – the perfect visual feedback tool for assurance in your mixing decisions.
Waveform
As well as the spectrogram and bar graph, VISION 4X features a waveform analyser that enables you to carefully inspect your sound source. Alongside the plugin's other visualisers, you can use the waveform analyser to magnify soundwaves and gain valuable pitch, volume and timing information, with an intuitive colour-coded display.
The waveform analyser is accompanied by VU and RMS metering tools, allowing you to assess volume and loudness levels with ease. Keep track of the headroom for your mix with an overshoot highlighting feature that informs you when levels are going above 0dB.
Phase Correlation Meter
Explore the stereo dimensions of your sound with VISION 4X's phase correlation meter, a tool that gives you an impression of your stereo spread and helps you to determine phase differences between the left and right channels. Any phase issues are clearly displayed along the centre line, helping you to maintain alignment and prevent any loss of audio when you're converting to mono.
YouTube.com/watch?v=F84q-qclYcI
Features:
- 4 real-time, high-definition visual analysers.
- Customisable and resizeable layout.
- 10 Colour Maps designed for maximum information density.
- Customisable Frequency Range and dB Range for spectral analysis.
- Freeze Display and Zoom-In functionality provides even deeper visualisation.
- Focus the colour map on specific frequencies with Map Curve/Tone Bias.
- Sync the analysis timeframe to your DAW.
- 2 Display Modes - Continuous visualisation or Overlay for visualisation that loops a timeframe and redraws the analysis.
- MIDI retriggering - Restarts the analysis whenever a MIDI signal is received.
- Information Bar shows pitch, note, dB and timing information on hover (A3 +7ct, -3.2db, bar 2.1.1).
- Stereo/Left/Right/Mid/Side modes.
- Presets designed by Noisia.
- M1 Native.
- Standalone mode.
- Spectrogram:
- High definition visualiser designed with enhanced low-end resolution.
- 3 FFT sizes for Transient, Harmonic and All-round analysis.
- Freeze, Zoom, Scroll functionality.
- Customisable Frequency Range and db Range.
- Bar Graph:
- Reference curves made by Noisia (including average and maximum values).
- Spectrum Highlight shows sustained and resonant frequencies.
- Adjustable Bar Number (from 4 bars to a Line graph).
- Peak dB values with adjustable Peak Hold time.
- Freeze, Zoom, Scroll functionality.
- Waveform:
- Detailed waveform analysis.
- Frequency detection with pitch colour mapping.
- Overshoot highlighting above 0dB.
- VU and RMS meters.
- Phase Correlation Meter:
- Stereo width and phase alignment metering.
- Gain Highlight.
Intro Pricing (January 8th, 2023):
- VISION 4X: £49 / €49 / $49 (Reg. £89 / $89 / €89).
- VISION 4X Lite £29 / €29 / $29 (Reg. £49 / $49 / €49).
Upgrades:
- VISION 4X Upgrade: £35 / $35 / €35.
- VISION 4X Lite Upgrade price: £25 / $25 / €25.